
TDR Prism: A Perceptual Spectrum Analyzer for Pre-Mix/Pre-Mastering Critical Listening
Tansel Günay (aka Punkat) — Punkat Music Sàrls | Steinsel / LUXEMBOURG
Before I touch any processing in mastering, I spend time doing critical listening while also building an analytical picture of the final mix my client delivered. Many spectrum analyzers provide “a lot of data”, but not all data turns into useful decisions. TDR Prism stands out because it’s designed around human perception: flexible spectral weighting/tilt options, a human auditory filter model, and real-time auditory masking visualization—tools that help the visuals stay closer to what we actually perceive.
This article covers Prism from two angles:
- Pre-mastering analytical listening (final mix check, issue spotting, reference comparison, decision prep)
- Mixing workflows (EQ decisions, masking/overlap reading, stereo decoding, transient/crest analysis)
1) The Prism mindset: analysis that follows perception
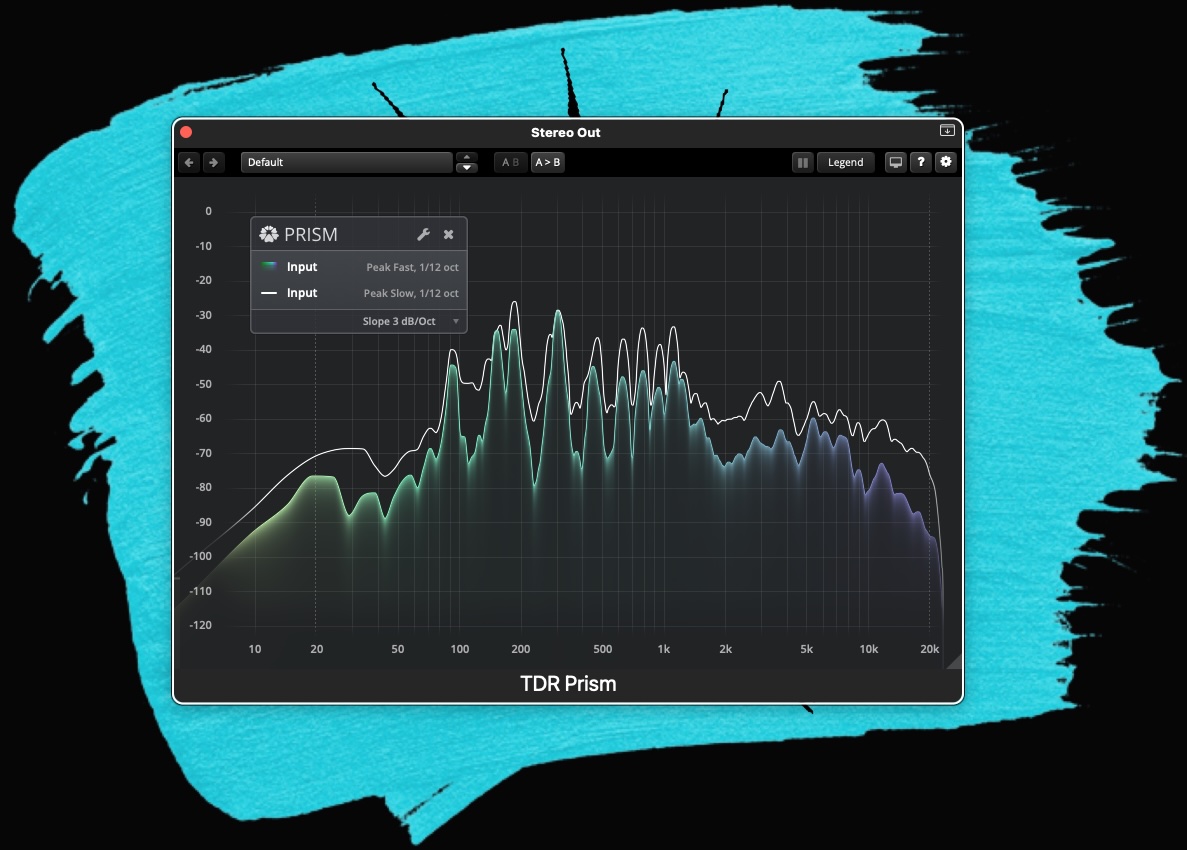
TDR Prism is a precise frequency analyzer focused on human perception. It offers:
- Multiple source options (Input, Sidechain, other Prism instances, File)
- Stereo decoding options (LR Avg, Left, Right, Sum, Diff)
- Peak/RMS detection plus timing/smoothing control
- Multiple spectral smoothing modes, including Human (ERB)
- Real-time Auditory Masking indication
- Inspection tools: crosshair, reference lines, tone generator, ruler tape, etc.
In pre-mastering, that translates to one big advantage: the analyzer is less likely to push you toward misleading conclusions compared to a raw FFT display. Weighting/tilt and masking help you see the spectrum in a way that’s often more aligned with listening.
2) Fast navigation: display + inspection tools
2.1 Filter Magnitude Display
Core daily actions:
- Hold Shift to magnify the view (4x)
- Hold Shift + drag to scroll horizontally
- Click to freeze the animation and inspect with a crosshair
- Ctrl+click (Win) / Command+click (macOS) to play a sine at the selected frequency
- Right-click a blank area to open the context menu
This is perfect for pre-mastering checks: the moment you hear harshness or a resonance, you can lock the display, find the exact frequency, and validate it quickly.
2.2 Ruler tape tool
Hold Alt/Option while clicking and dragging to draw a ruler tape. Hover it to see start/end points and the frequency/gain interval. Move/resize it, and delete it via double-click or Alt/Option+click.
It’s a small feature that makes your notes more precise: “This build-up spans roughly 200–400 Hz” becomes an objective observation.
2.3 DC Level Indicator
Prism estimates DC level. The manual notes limits when detecting DC in finite-length signals and mentions possible false positives; if uncertain, Prism may fade the meter out.
In mastering prep, DC offset matters because it can waste headroom and affect dynamics processing behavior. If it shows up, it’s often better fixed upstream.
2.4 Plot Legend + Fullscreen
The Plot Legend summarizes all visible plots and can be dragged. You can hide it entirely—or auto-hide during inspection. Fullscreen mode is a real benefit during long critical-listening sessions.
3) The core engine: the 4-plot workflow
Prism can display up to four plots, each configured independently (source, decoding, detection, smoothing, style, etc.).
3.1 Plot Source
Each plot can be fed from:
- Input
- Sidechain
- Plugin Instances (another Prism instance in the project)
- File
- You can also enable a calibration slider to gain-match sources for fair comparison.
A typical pre-mastering layout:
- Plot 1: client mix (Input)
- Plot 2: reference (File)
- Plot 3: same mix with Diff decoding (stereo difference)
3.2 Plot Decoding
Stereo decoding options:
- LR Avg
- Left / Right
- Sum
- Diff
For mono-compatibility and width diagnostics, Sum/Diff is extremely efficient. Diff can reveal side-heavy midrange or phase-related “false width”; Sum helps you understand what collapses to mono.
3.3 Detection: Peak vs RMS
Detection modes:
- Peak
- RMS
In pre-mastering:
- RMS helps read overall tonal balance more calmly
- Peak highlights transient behavior and spiky areas that may drive limiters
3.4 Detection Timing
Fast / Default / Gentle / Slow / Infinite
Infinite is great for building a stable “whole-track” view—especially RMS + Infinite when you want the long-term spectral character, not momentary movement.
3.5 Spectral Smoothing
Raw, octave fractions, and Human (ERB) are available.
Pre-mastering often benefits from Human (ERB) for a perception-aligned read; mixing may benefit from Raw or 1/12 for surgical work.
3.6 Ridge Mode
With Ridge Mode active, plots block those drawn below them—useful when inspecting dynamic crests like peak-to-RMS relationships.
4) My pre-mastering analytical listening workflow in Prism
Step 1: Build a stable 2–3 plot template
- Plot 1 (Input): RMS + Infinite + Human (ERB)
- Plot 2 (Input): Peak + Fast/Default + Raw or 1/12
- Plot 3 (Input): Diff decoding (often RMS + Gentle)
This gives you: long-term tone, transient behavior, and side energy—at the same time.
Step 2: Use Analyzer Weighting to improve readability
Prism supports multiple weighting approaches:
- No Weighting
- Slope (Tilt) (useful for visually linearizing typical music spectra; 3 dB/Oct relates to inverse pink noise; 4.5 dB/Oct is mentioned as a common starting point)
- Cinema X-Curve / N-Curve (inverse)
- A/B/C/D Weighting
- ITU-R 468, ISO 226 (80 Phon inverse), K-weighting
- Groove Geometry
- User-defined slopes (JavaScript)
For pre-mastering, I often start with Slope (Tilt) to make the overall curve easier to interpret, then switch to other weightings only when needed (e.g., noise suspicion).
Step 3: Enable Auditory Masking to judge “what matters”
Prism can visualize Auditory Masking (masked regions appear semi-transparent) and can invert it to show only the masked spectrum.
This helps answer practical questions:
- “There’s a lot of energy here—does it actually contribute?”
- “Is this density likely to create fatigue or reduce intelligibility?”
The manual discusses masking density in terms of redundancy and intelligibility, and notes that high masking activity can induce listening stress/fatigue.
Important note: the manual also states masking has no effect on spectra imported/generated from external files (masking is largely momentary).
So if you’re using a File plot for references, rely on masking mainly for the live Input.
Step 4: Crosshair + Tone Generator to verify suspicious areas
Freeze → crosshair → Ctrl/Command-click to play a sine at that frequency.
From the context menu, Prism offers tone generator modes like Static/Dynamic Sine, Dynamic Noise, and Bandpass.
Bandpass monitoring is especially useful to confirm whether the “problem” is truly in that band.
Step 5: Measure bands with the ruler tape
Alt/Option + drag → measure frequency span and gain interval → write clearer notes.
Step 6: Adjust Analyzer Precision (timing vs resolution)
Prism offers Low/Medium/High analyzer precision and notes that temporal precision is generally inversely proportional to spectral precision; choose lower precision for faster response.
Pre-mastering often benefits from Medium/High; mixing troubleshooting may benefit from faster response.
5) Prism in mixing: fast problem-hunting and verification
5.1 EQ decisions with the right smoothing model
- Raw/1/12 for resonance spotting
- Human (ERB) for perception-aligned balance reading
5.2 Sidechain + instance comparisons
Because a plot can be sourced from Sidechain or another Prism instance, Prism becomes a powerful comparison hub.
Examples:
- Sidechain kick vs bass bus to monitor low-end overlap
- Compare a vocal-chain Prism instance against a mixbus Prism instance
- Compare pre-EQ and post-EQ points using multiple instances, gain-matched via calibration
5.3 Peak/RMS crest inspection with Ridge Mode
Ridge Mode improves readability when you’re evaluating crests (peak vs RMS behavior).
6) Advanced: writing your own custom slopes
Prism supports up to 10 custom slope programs saved globally. You can clone factory programs, edit them in the slope editor, and build additional curves using a simple JavaScript main(f) function. The manual also describes Prism and Biquad helper objects (conversion, interpolation, piecewise curves, biquad filter response, etc.).
This is ideal if you want a very specific “visual reference curve” tailored to your monitoring environment or personal workflow.
7) Small but important practical notes
- Preset management: User preset’ler global kaydedilir, limit 20. Copy/Paste/Share state ile instance’lar arası hızlı taşıma yapılır.
- A/B: iki farklı state’i hızlı kıyasla.
- Inspection sırasında legend gizleme: crosshair okurken ekran temizlenir.
- Tooltip show note + A4 tuning: frekansın en yakın notaya çevrilmesi, özellikle resonans “nota” ilişkisi kurarken işe yarar.
- UI scale / fullscreen / high contrast: uzun seanslarda göz yorgunluğunu ciddi azaltır.
Closing: use Prism as a microscope, not as the judge
For me, TDR Prism is one of the most useful tools in the pre-mastering stage: it helps me read tonal balance, stereo behavior, crest dynamics, and masking quickly and precisely—so I can enter mastering with a clear plan. In mixing, it speeds up comparison and problem-hunting.
Still, the final decision should always come from ears + references + artistic goal. Prism doesn’t replace listening—it makes listening more informed.